Rendered at 06:02:37 06/02/25


Digital Download
Support Resistance with Trend Lines Algorithm Trading Indicator for TradingView
$100.00
Handling Fee
FREE
Return policy
None: All purchases final
Purchase protection
Payment options
PayPal accepted
PayPal Credit accepted
Venmo accepted
PayPal, MasterCard, Visa, Discover, and American Express accepted
Maestro accepted
Amazon Pay accepted
Nuvei accepted
Handling Fee
FREE
Return policy
None: All purchases final
Purchase protection
Payment options
PayPal accepted
PayPal Credit accepted
Venmo accepted
PayPal, MasterCard, Visa, Discover, and American Express accepted
Maestro accepted
Amazon Pay accepted
Nuvei accepted
Listing details
| Seller policies: | |
|---|---|
| Shipping discount: |
Shipping is free for digital goods. |
| Price discount: |
5% off w/ $150.00 spent |
| Posted for sale: |
More than a week ago |
| Item number: |
1634700052 |
Item description
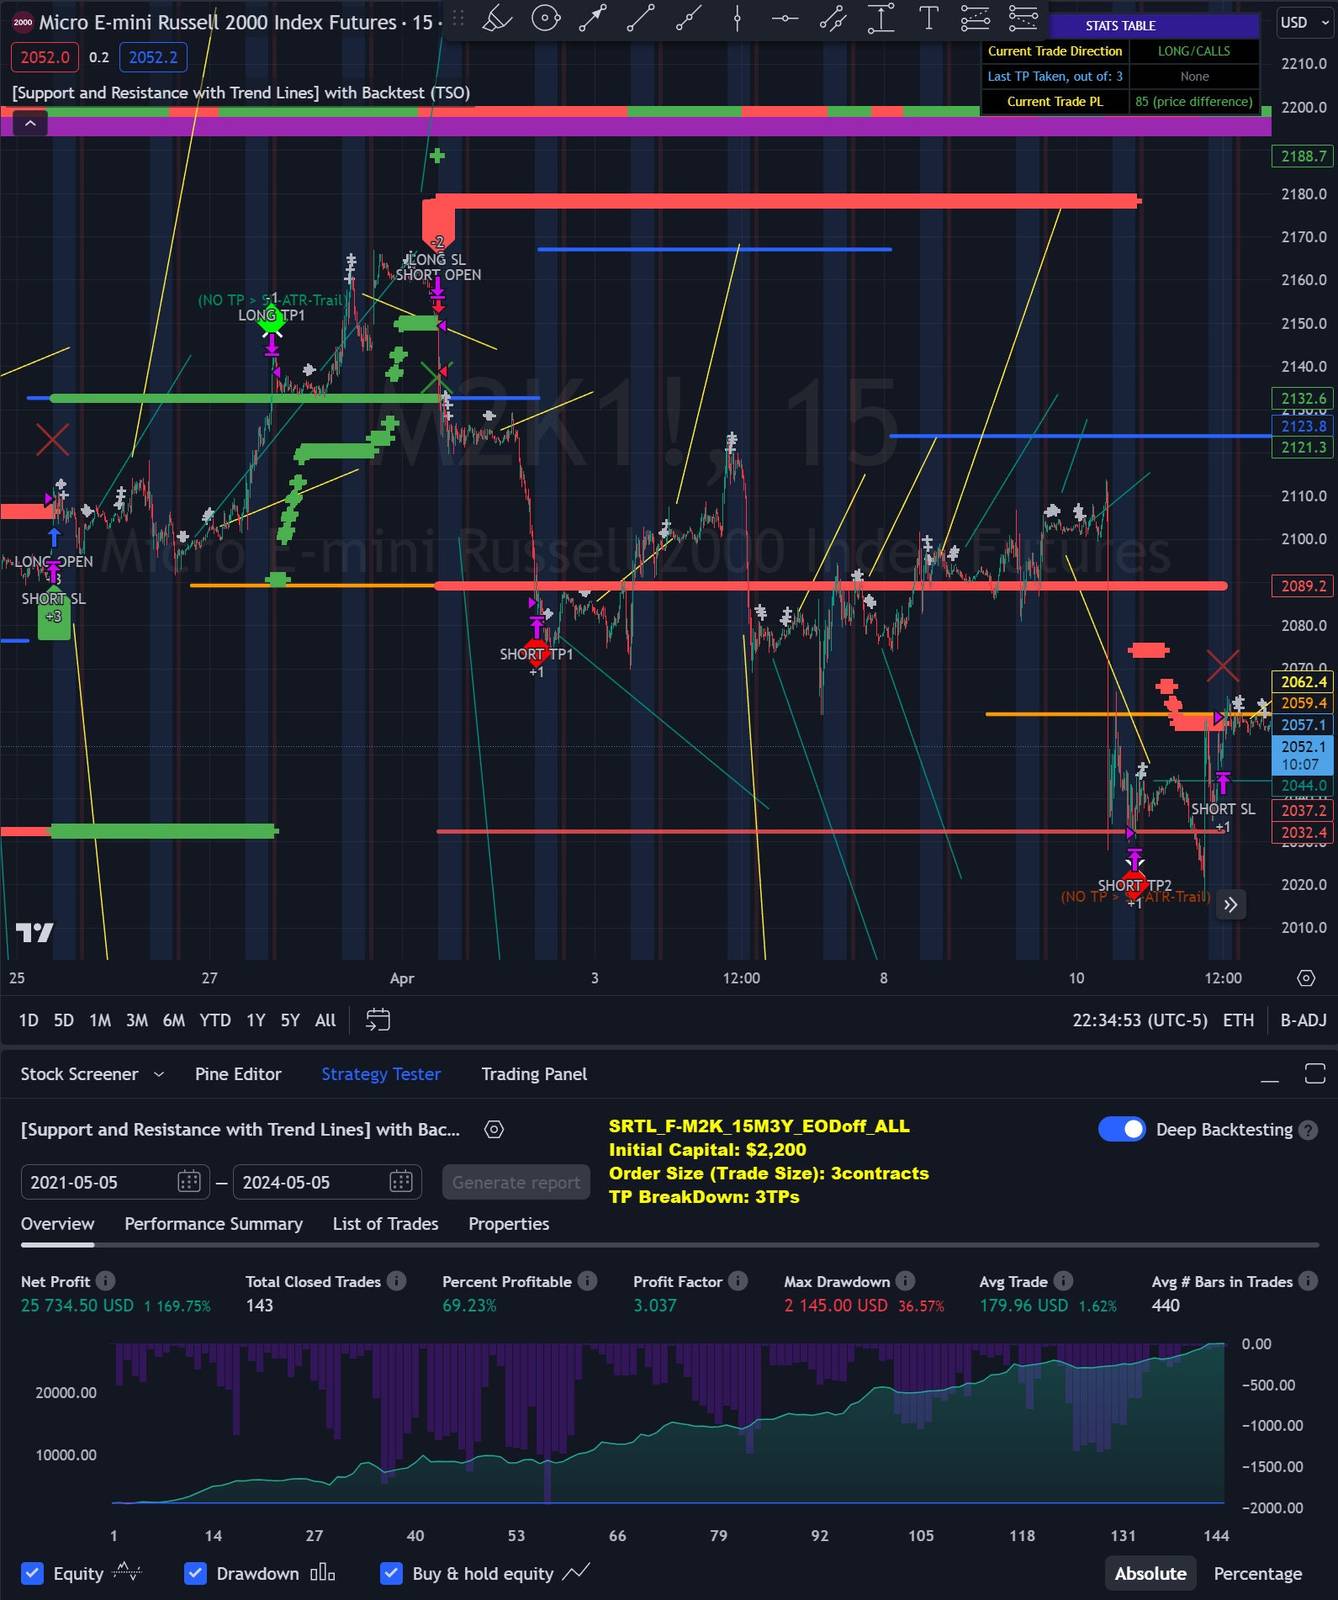
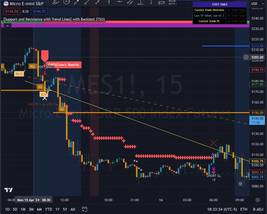
SUPPORT AND RESISTANCE / TREND LINES
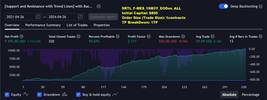
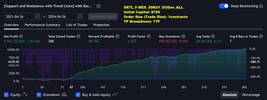
Deep Backtesting feature allows to see if there is a long-term potential in a strategy
Great for any trading style (Intraday/Swing/Scalping), works well with Futures, Indices, Stocks
Full-cycle trading system, with labels and alerts from trade open to trade close
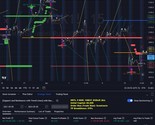
Provides TP (Take-Profit) and SL (Stop-Loss) levels at trade open alert
Every calculation is done on a confirmed closed candle bar, so the indicator will never repaint
Works on the most popular timeframes: 1M, 3M, 5M, 15M, 30M, 45M, 1H, 4H
NOTE: At position open - there will be calculated Take-Profit and Stop-Loss targets, however each target is considered hit, when candle bar closes breaking that target, so Take-Profit and Stop-Loss when hit will slightly differ then levels at position open!
Our product stands out by providing Backtesting results for every Trading Strategy, validating the potential of our algorithms. While there's inherent risk in any investment and our approach is certainly riskier than 1.5-5% Certificate of Deposit (CD), it offers more promising outcomes based on historical patterns. This potential is notable in cryptocurrencies, futures, FOREX pairs, indices, stocks and commodities.
Indicator Main Features
Current and Historical S R (Support and Resistance) with Trend Lines breakout and bounce reversal trade signals.
2 TP (Take-Profit) systems and 5 SL (Stop-Loss) systems, static/dynamic/trailing, Automated ATR (Average True Range) trailing SL (Stop-Loss), minimizing the risk.
Single or Multiple profit targets (up to 5).
Candle bar signal analysis (matching candle direction/color, skip opposite structured and/or doji candle uncertain signals).
Additional analysis of signals through VWAP/EMA/ATR/EWO/MACD+RSI/Volume for best potential trades.
Advanced Alerts with JSON output, which can be potentially setup with a trading bot over TradingView Webhook (NOTE: This will require advanced programming knowledge).
Trading Schedule with customizable trading daily time range (set your own trading schedule), automatic trade daily closing alert at any hour or leaving the trade open overnight until it either hits TP (Take-Profit) or SL (Stop-Loss) target(s).
Added to your wish list!
- Support Resistance with Trend Lines Algorithm Trading Indicator for TradingView
- 50 in stock
- Handling time 1 day.
Get an item reminder
We'll email you a link to your item now and follow up with a single reminder (if you'd like one). That's it! No spam, no hassle.
Already have an account?
Log in and add this item to your wish list.